Visibility, Context, and Control for AI Agents
The only AI observability platform purpose-built for agentic systems. Monitor, evaluate, protect, and govern your agents and models from development through production.
Deliver High-Performance AI
Gain visibility from application to span level. Monitor agents across their entire lifecycle with evaluations in development and continuous monitoring in production.
Protect From Costly Risks
Enforce runtime guardrails and use root cause analysis to detect quality regressions, policy violations, and unsafe outputs before they impact users.
Maximize ROI
Connect agent performance to business KPIs. Track cost, latency, quality, and throughput to optimize operations and reduce total cost of ownership.
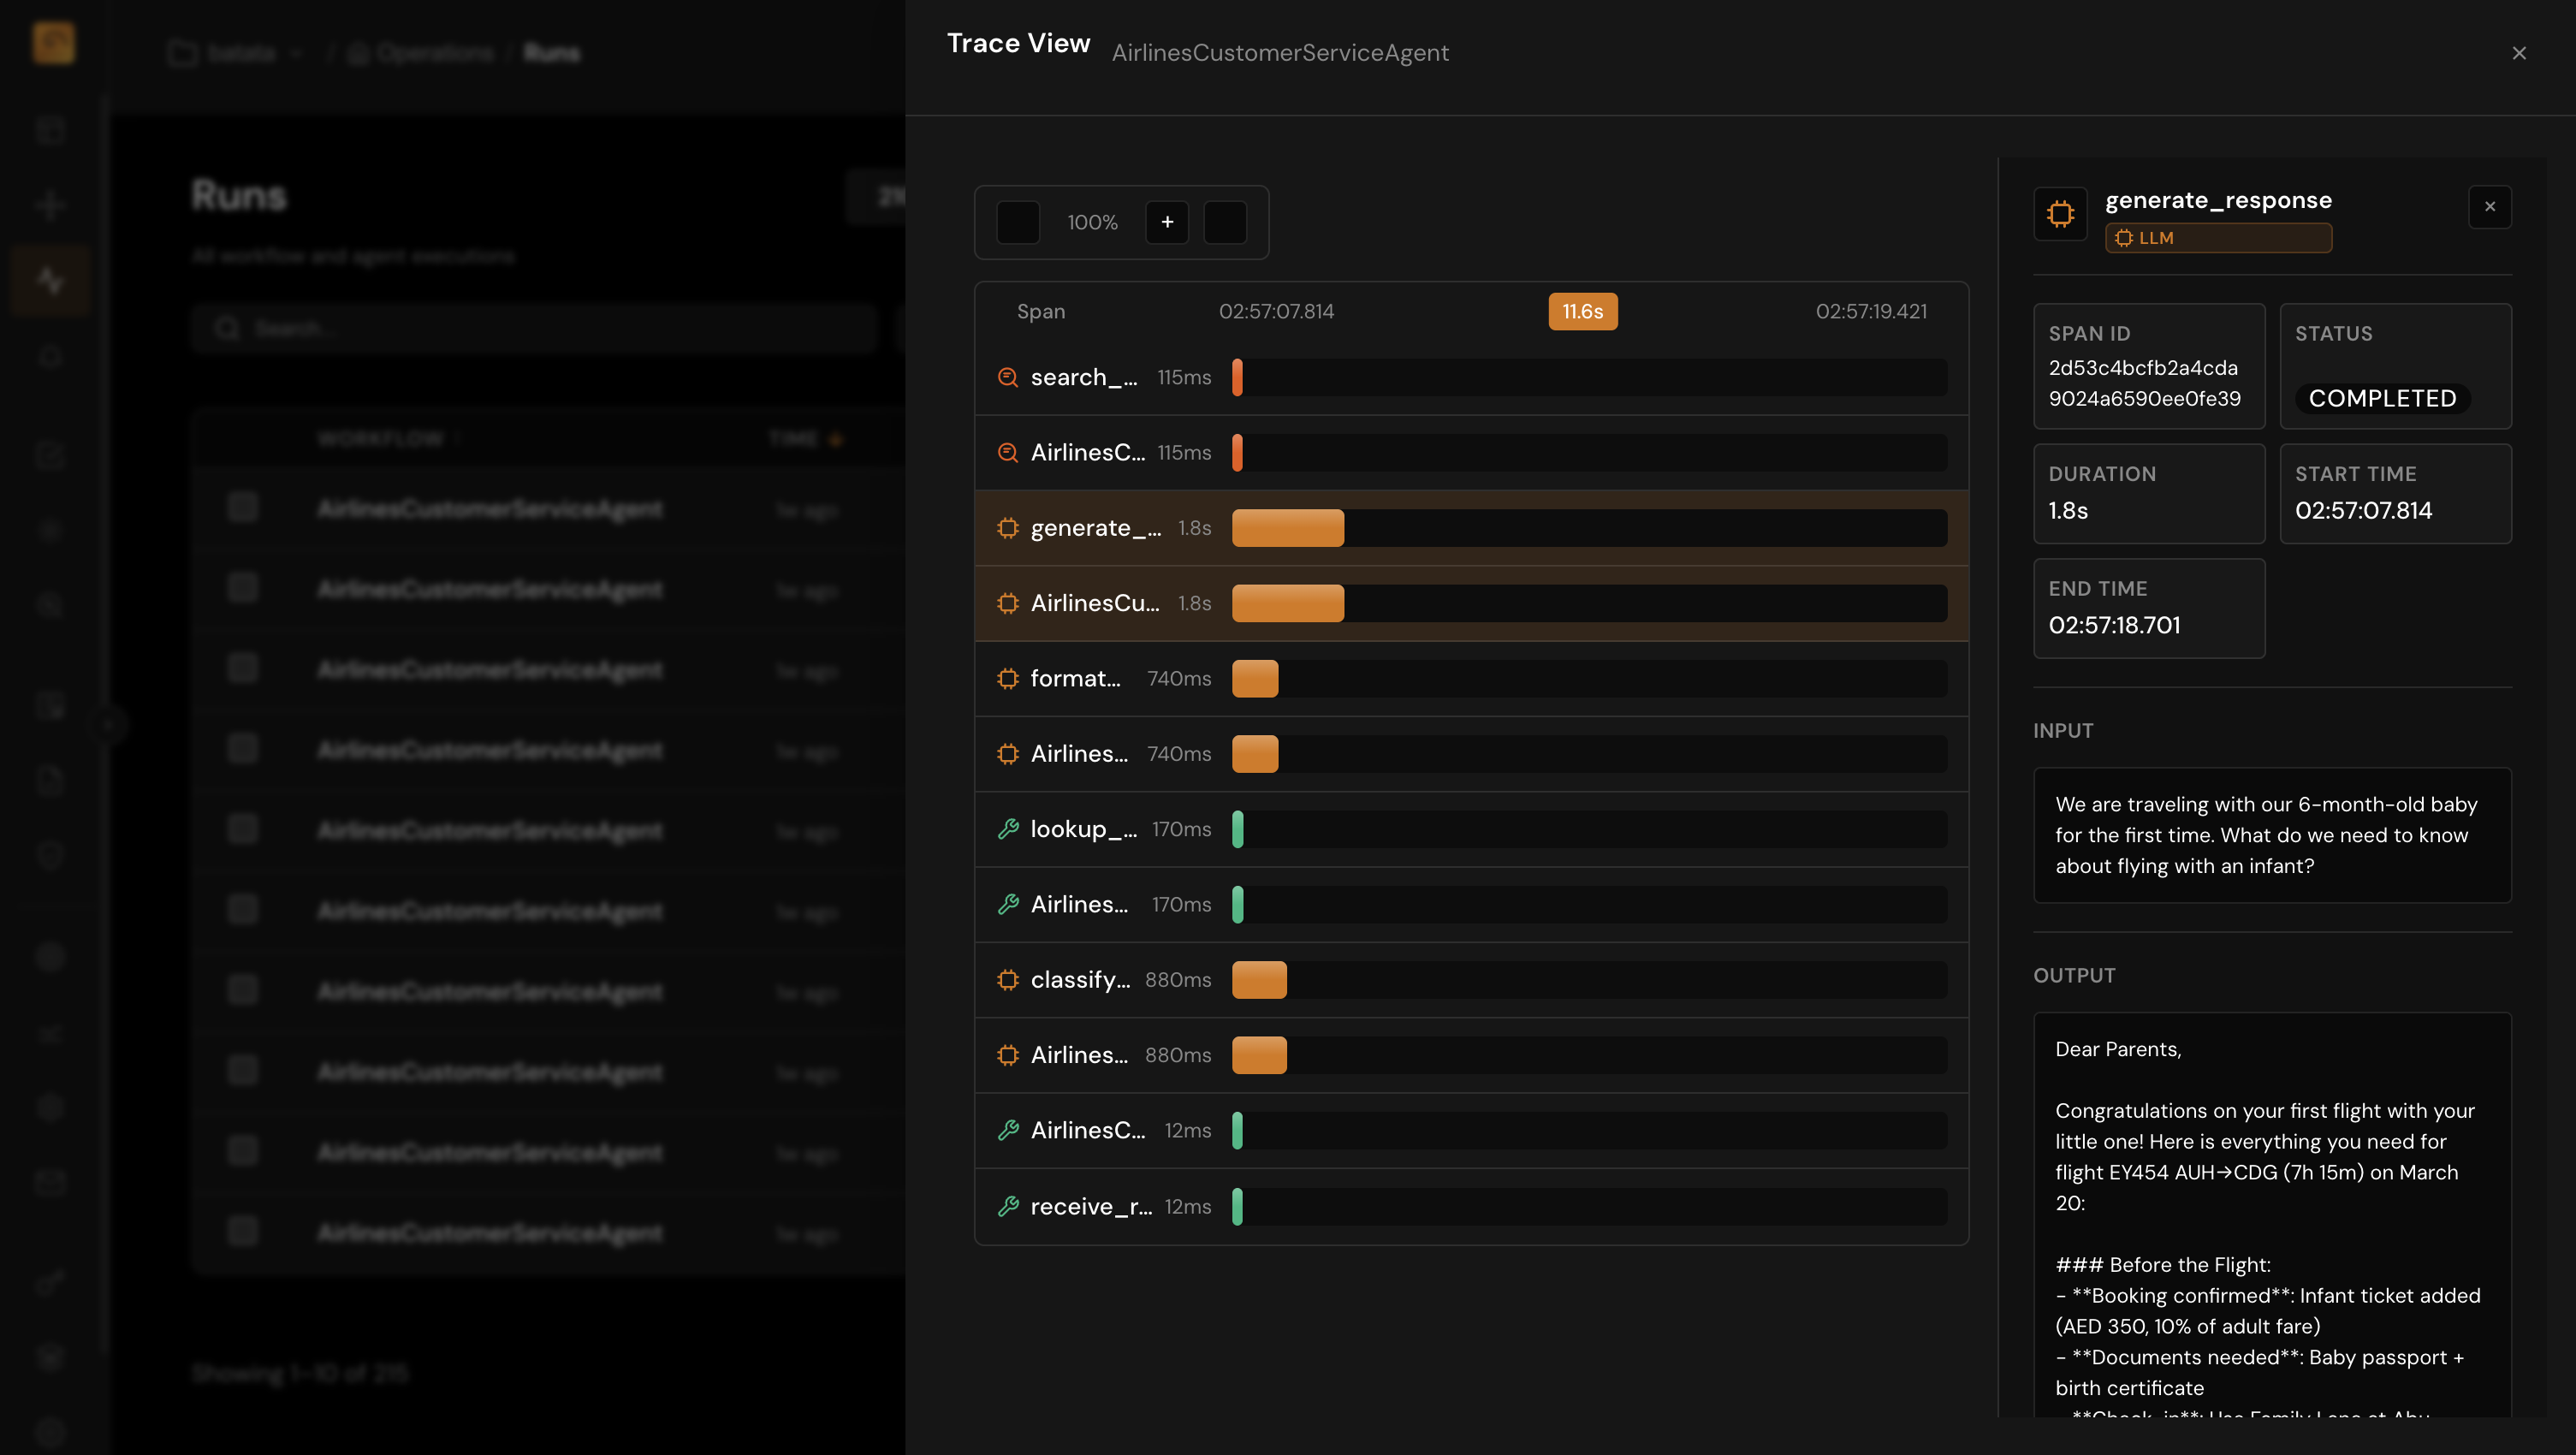
Complete Visibility from Development to Production
Without proper monitoring, agent failures go undetected and raw event logs pile up. TuringPulse transforms telemetry into actionable insights across the entire agentic hierarchy.
- Trace execution paths from application → session → agent → trace → span
- Monitor 50+ out-of-the-box metrics including hallucination, toxicity, drift, and custom KPIs
- Evaluate in development and monitor in production with a continuous feedback loop
- Reduce MTTI and MTTR with real-time alerts when performance degrades
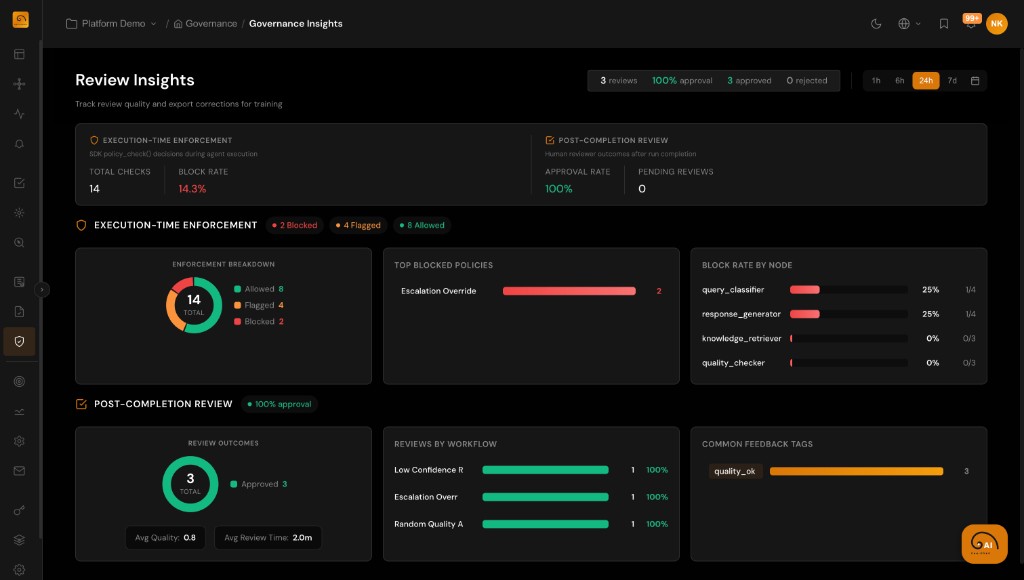
Enforce Control Before Costly Risks Happen
Agents make autonomous decisions that can violate compliance requirements or produce harmful outputs. TuringPulse enforces policies and guardrails at runtime to prevent incidents.
- Define runtime policies with compliance packs for HIPAA, GDPR, and industry standards
- Route high-risk decisions through human-in-the-loop review queues
- Detect quality regressions and drift with automated anomaly detection
- Get notified instantly with configurable alert channels
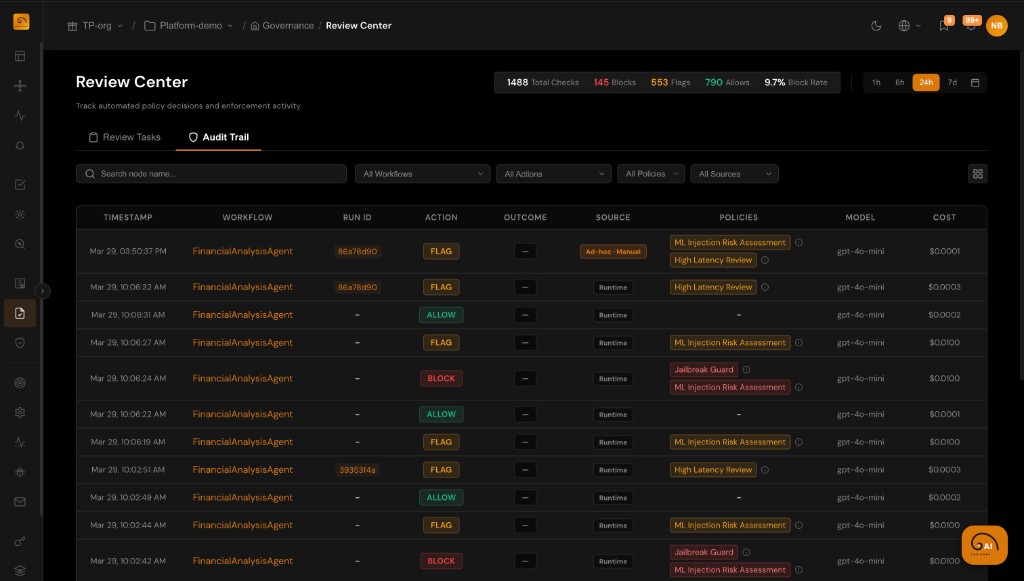
Executive Oversight and Compliance for Enterprise AI
Fragmented AI deployments create accountability gaps. TuringPulse provides centralized governance with complete audit evidence and executive dashboards.
- Unified dashboards connecting agent behavior to business outcomes
- Complete audit trail of every decision, action, evaluation, and policy outcome
- Generate evidence aligned with GDPR, HIPAA, SOC 2, and regulatory requirements
- Track ownership, responsibilities, and approvals across all AI applications
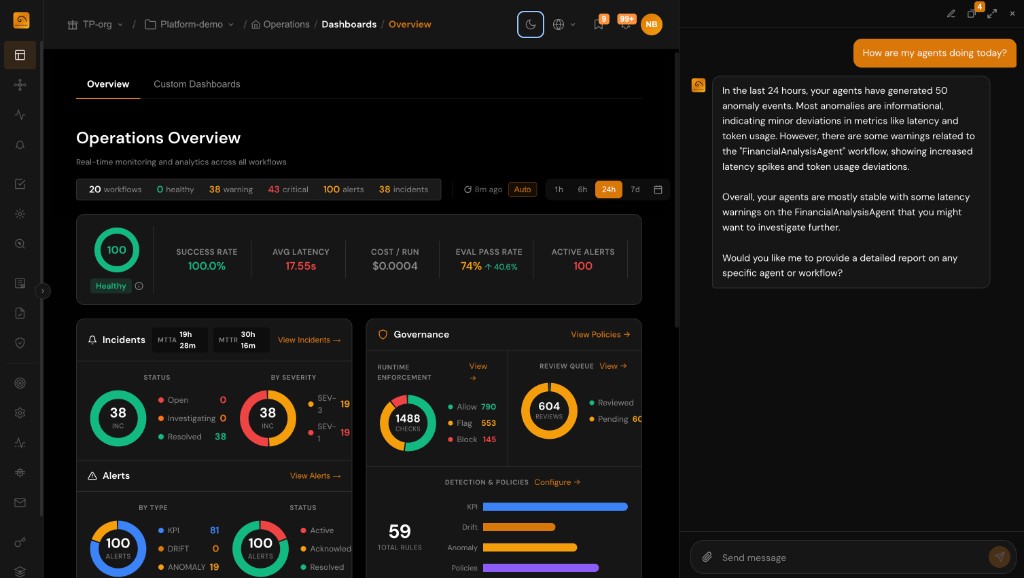
A Built-in Agent for Configuration and Insight
The same platform that observes your agents includes an in-portal AI Assistant to help you configure and understand them—without jumping across docs and screens alone.
- Ask natural-language questions about traces, KPIs, incidents, and evaluations in your project
- Get draft KPI, drift, and anomaly rules plus governance policies and dashboard suggestions grounded in your data
- Nothing applies automatically: review drafts and apply changes through the product flows you already use