End-to-End Monitoring for AI Agents
Monitor every agent interaction with traces, KPIs, drift detection, anomaly alerts, and root cause analysis. Know what is happening inside your agents — and why.
Full Observability
Trace every agent execution from application to span level. See tool calls, LLM interactions, reasoning steps, and outputs in a unified timeline.
Detect Issues Early
Drift detection and anomaly alerts surface quality regressions, behavioral changes, and performance degradation before they impact users.
Reduce MTTR
Root cause analysis pinpoints the exact span where failures occur. Correlation insights link configuration changes to performance shifts.
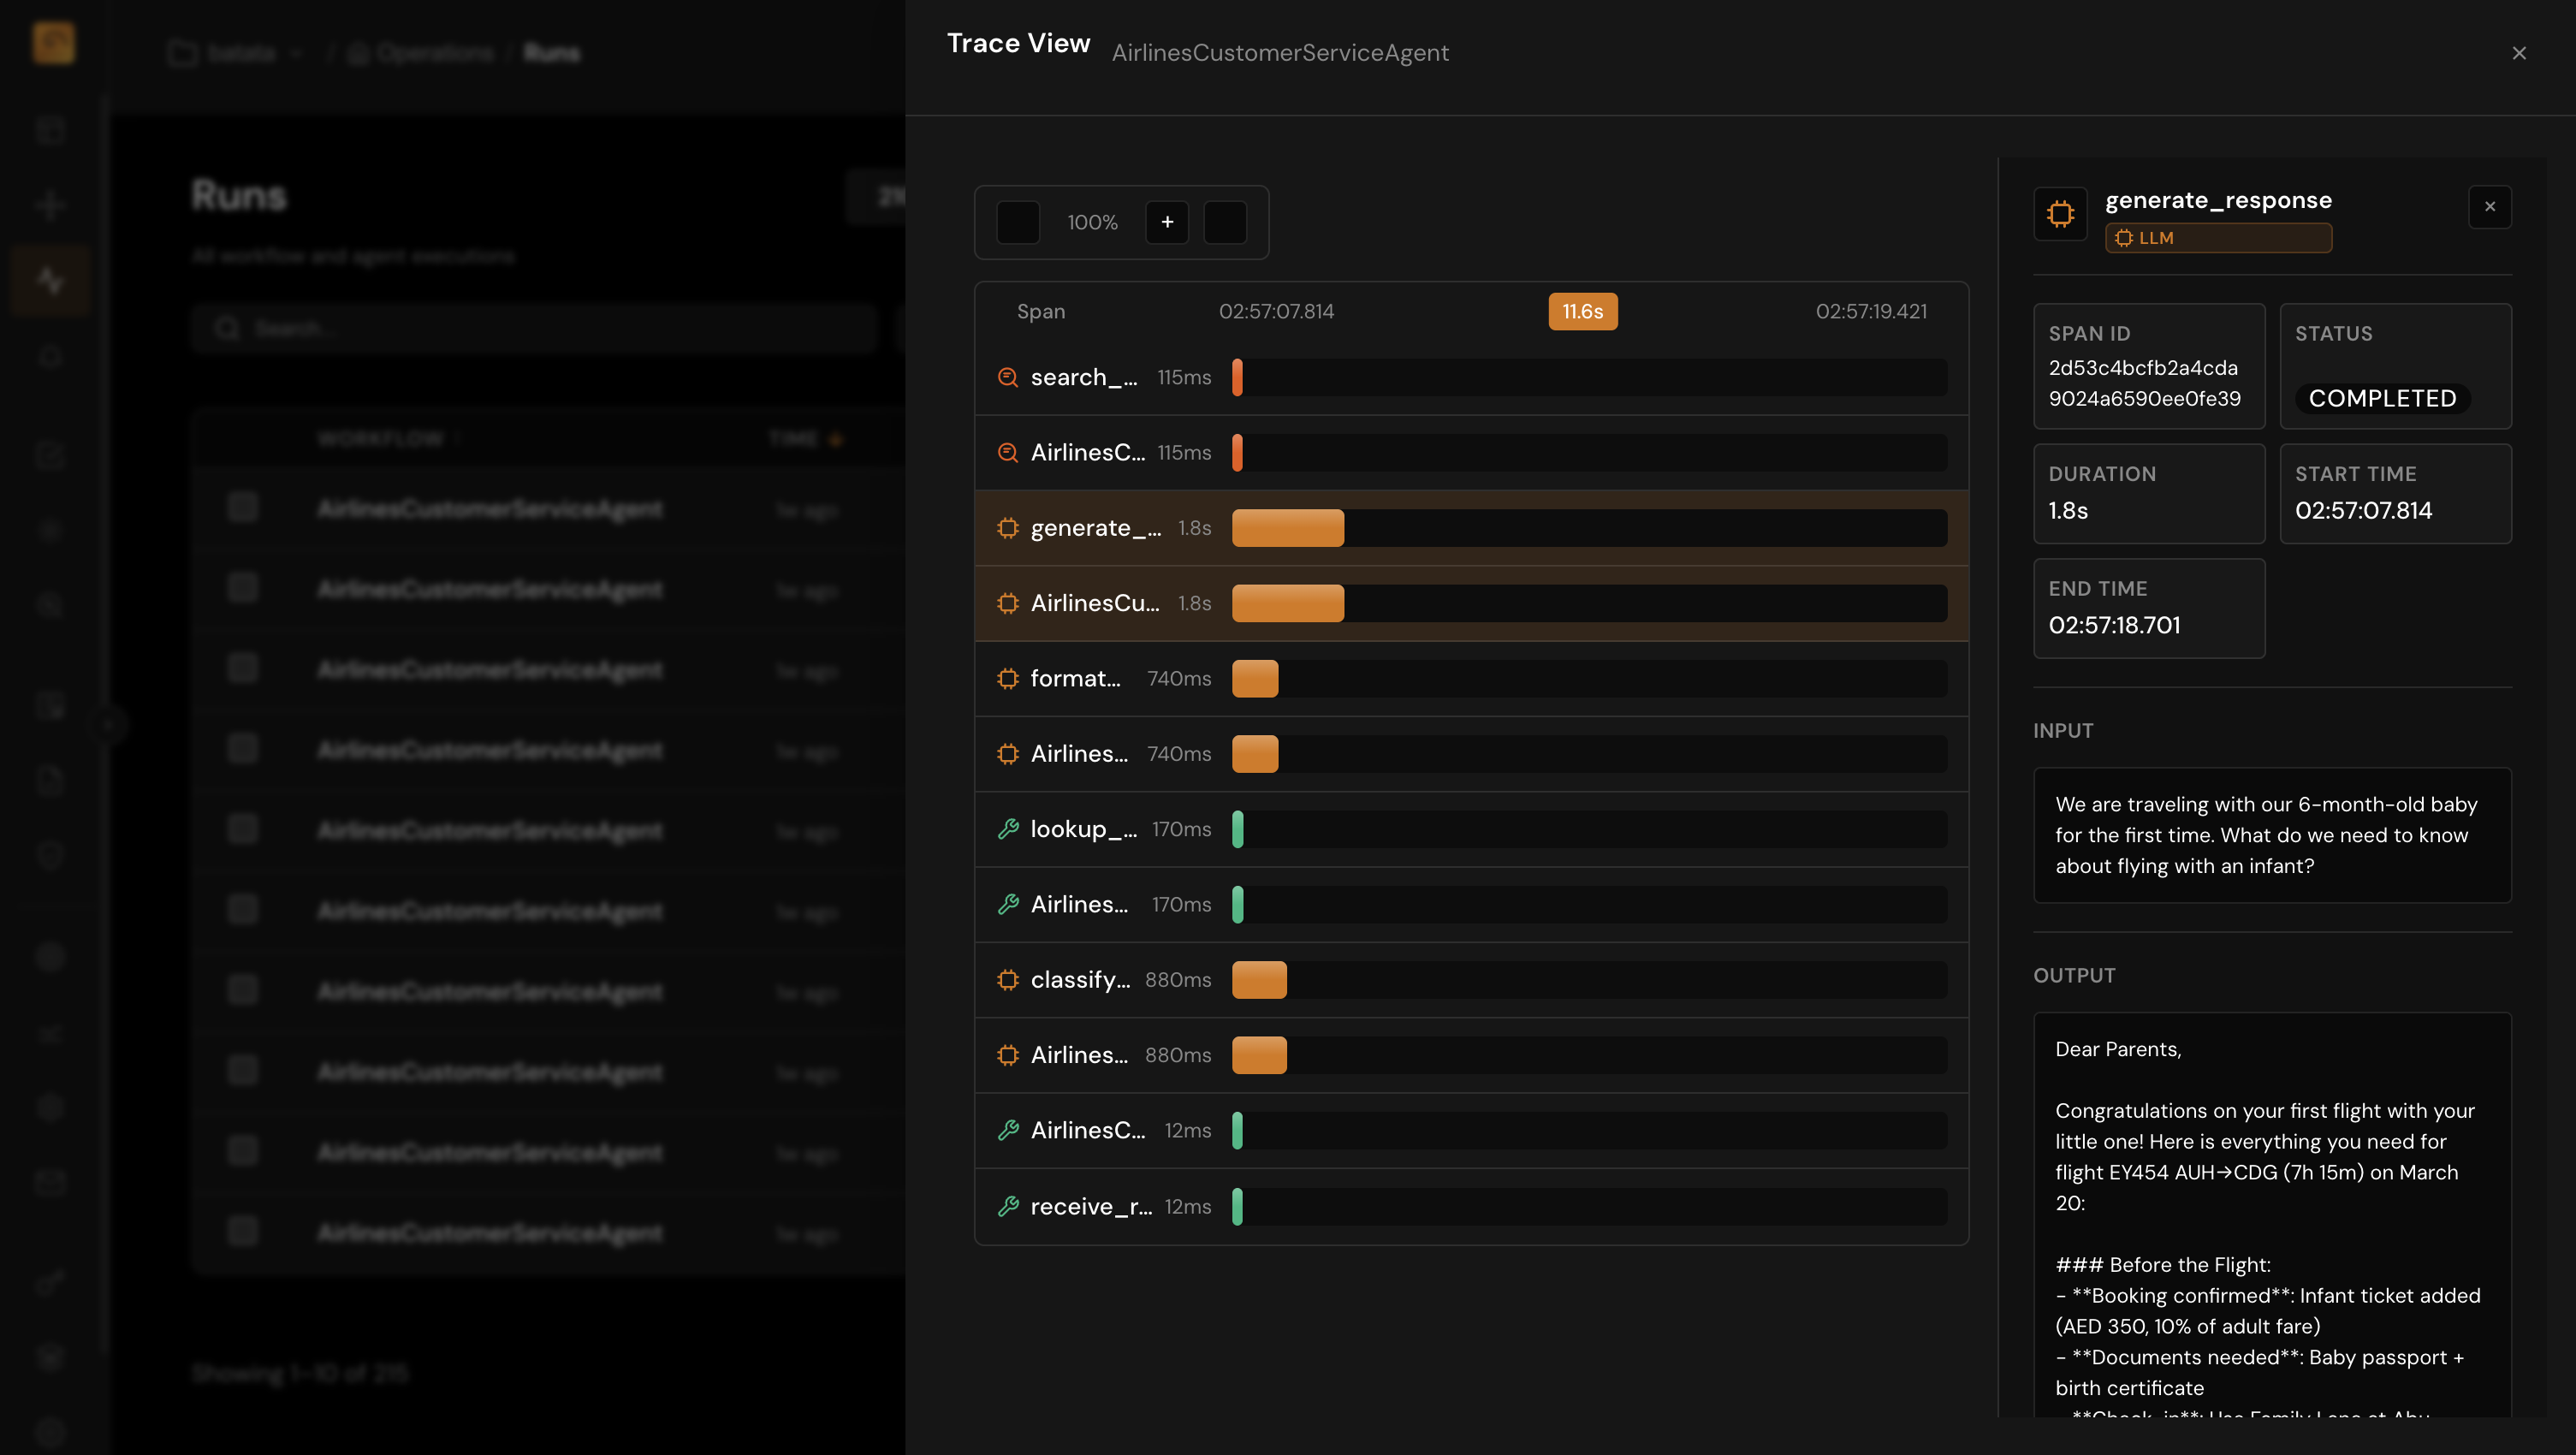
Trace Every Agent Decision
TuringPulse captures the full execution hierarchy for every agent interaction — giving teams complete visibility into what happened and why.
- Hierarchical trace view: application → session → agent → trace → span
- Record tool calls, LLM prompts/responses, reasoning steps, and metadata
- Search, filter, and sort traces by any attribute or evaluation score
- Link related traces across multi-agent workflows and sessions
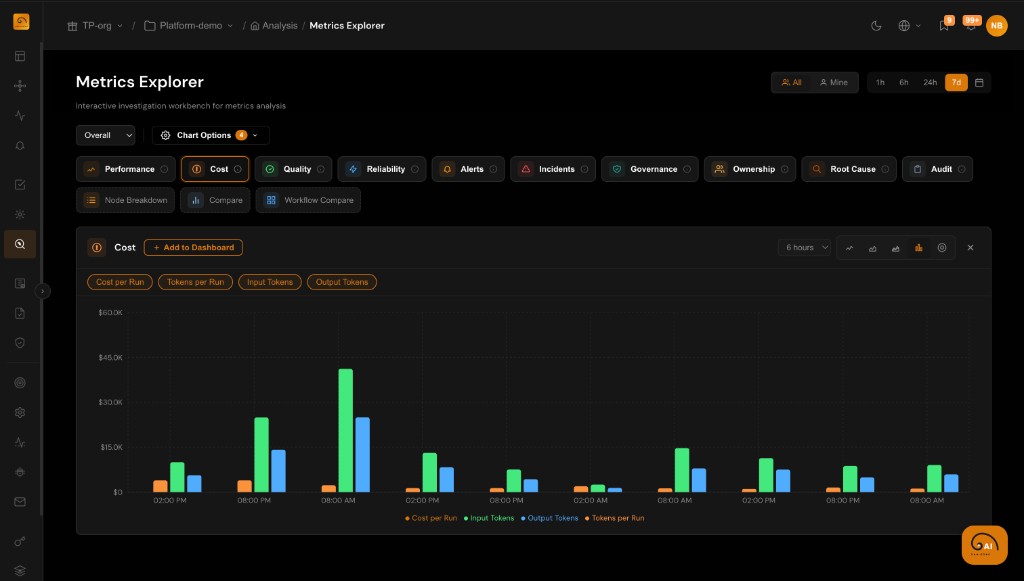
Track What Matters with Custom KPIs
Define the metrics that matter for your use case. TuringPulse monitors KPIs continuously and alerts you the moment they drift from baselines.
- 50+ built-in metrics for quality, safety, cost, and performance
- Custom KPI definitions based on evaluation scores and span attributes
- Statistical drift detection against configurable baselines
- Anomaly detection surfaces unexpected behavioral changes automatically
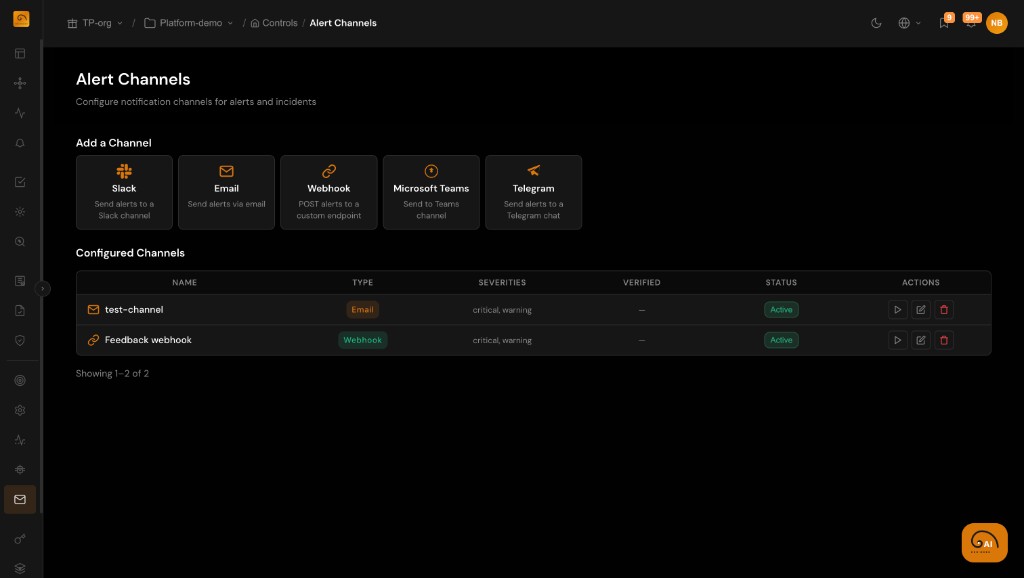
Real-Time Alerts Across Your Stack
Get notified the moment something goes wrong. Configure alerts per metric, per severity, and per team — with full execution context in every notification.
- Alert channels: Slack, Microsoft Teams, Telegram, email, and webhooks
- Per-metric threshold rules with configurable sensitivity
- Escalation policies for critical incidents
- Alert history and acknowledgment tracking for incident response