Prompt Debugging & Trace Replay
See every decision your agent makes—replay executions, inspect inputs and outputs at each node, and compare runs so prompt and tool fixes are evidence-based, not speculative.
Full Trace Replay
Reconstruct the exact sequence of model calls and tool invocations instead of rebuilding conversations from scattered logs.
Span-Level Inspection
Open any node to read prompts, completions, retrieved context, and errors. Find the one bad retrieval or malformed tool args in seconds.
Version Comparison
Compare runs after a prompt or model change. Diff behavior across traces, not just final answers, so regressions are obvious.
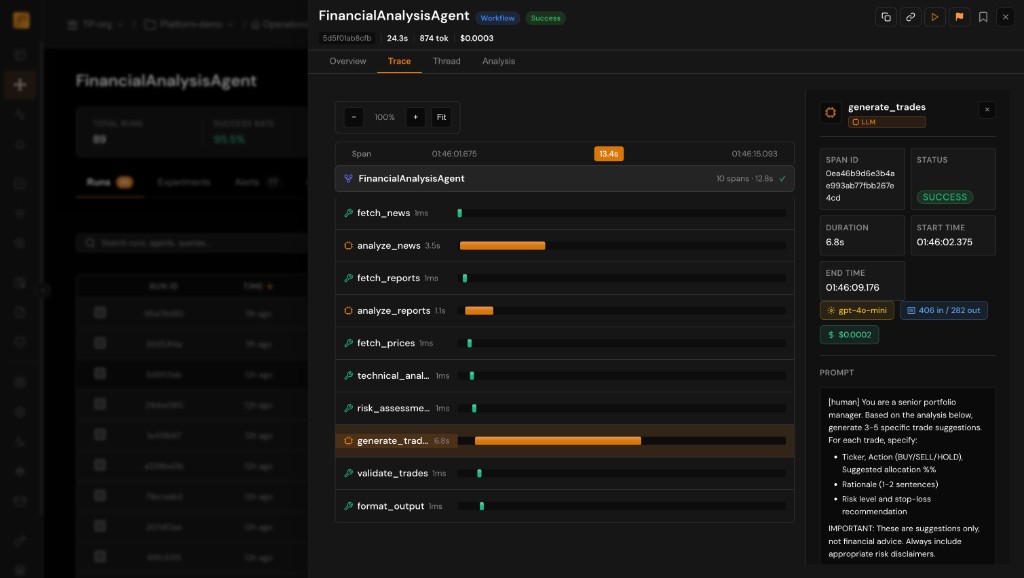
DAG Visualization of Agent Workflows
Complex agents are graphs, not straight lines. Render branches, loops, and parallel tool calls so debugging matches how your code runs.
- Hierarchical DAG aligned to trace and span relationships
- Highlight slow, failing, or high-token nodes instantly
- Navigate from overview to span detail without losing context
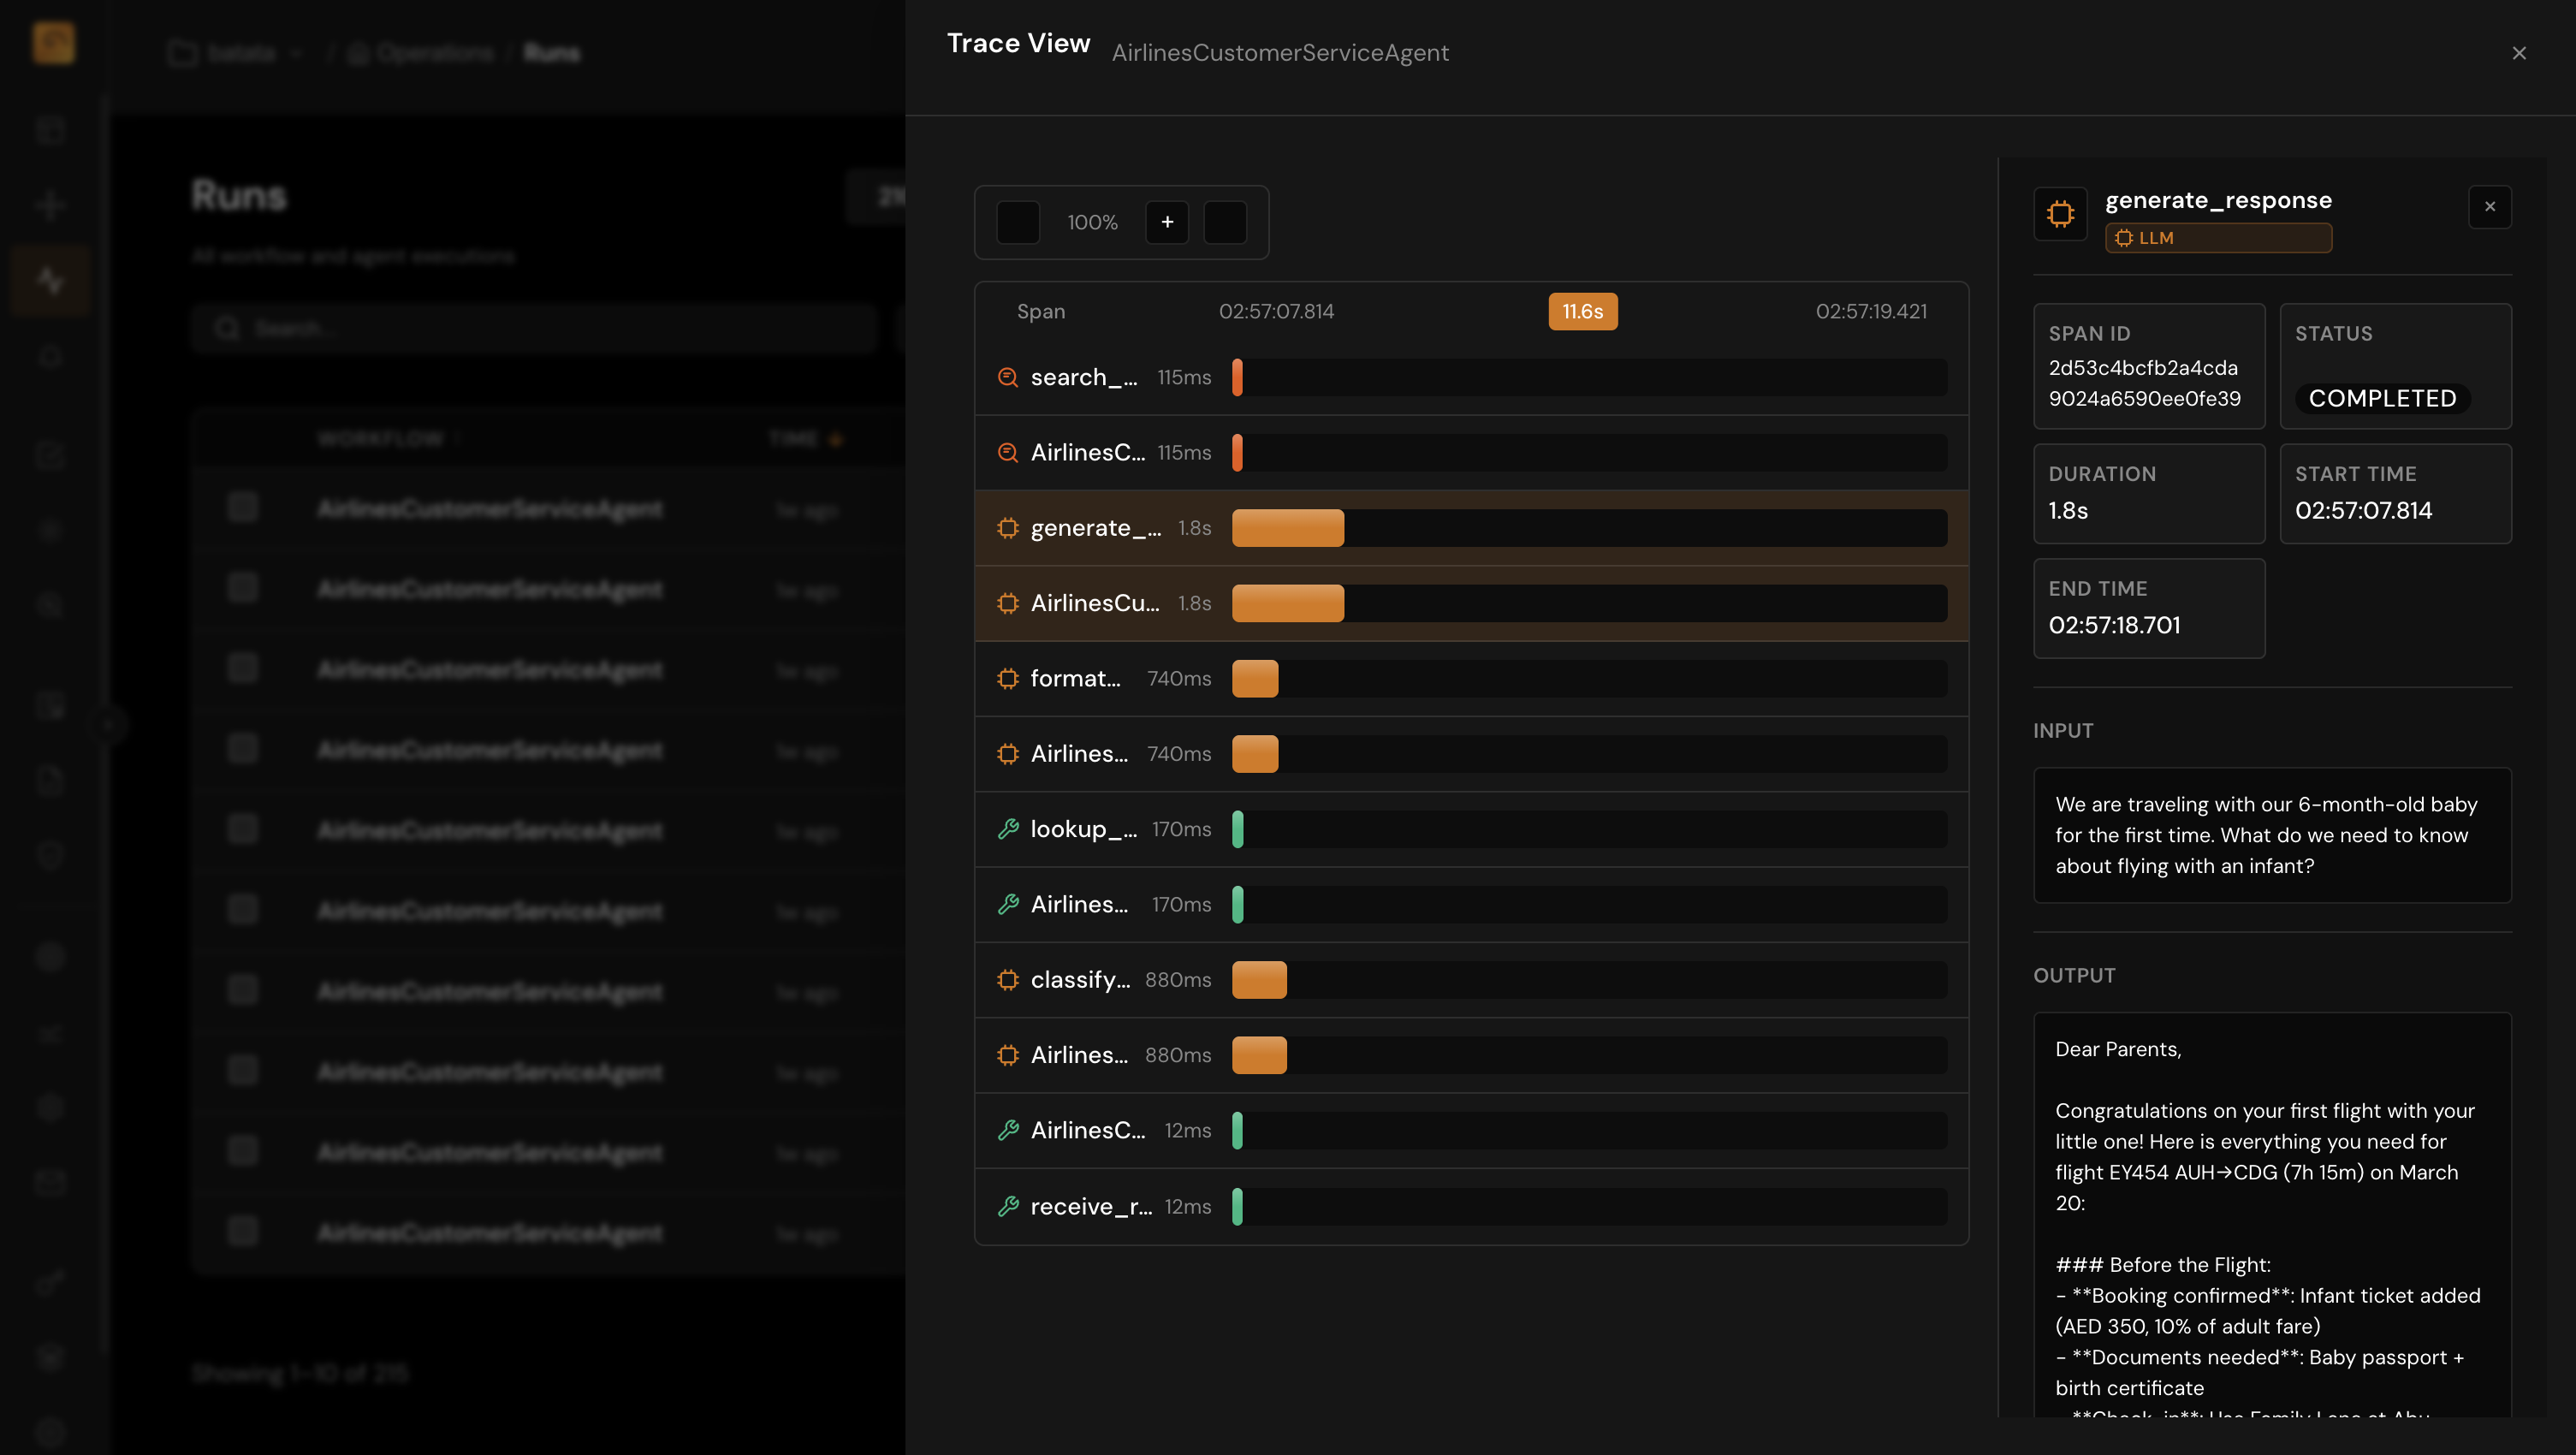
Input and Output Inspection at Every Node
The bug is rarely only in the final answer. Inspect what the model saw and what it returned at each step.
- Full prompt and completion text with token and timing metadata
- Tool arguments and return payloads for debugging contract mismatches
- Retriever hits and scores to validate grounding and RAG quality
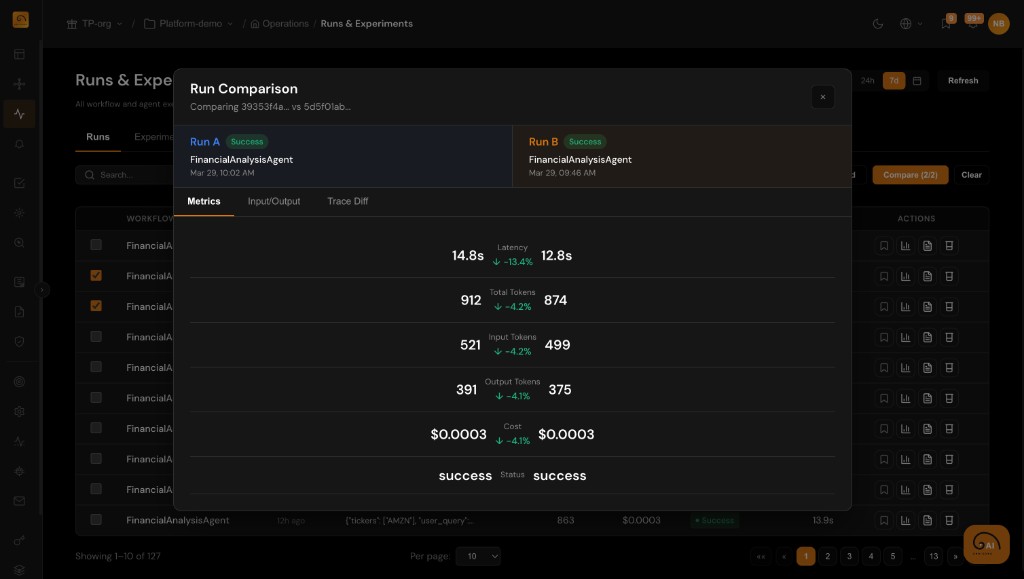
Compare Runs Across Versions
Ship prompt tweaks with confidence: compare traces across runs and identify where behavior diverged.
- Search and filter runs by version, model, or time range to isolate changes
- Inspect span-level differences in latency, tokens, and outputs across runs
- Pair with evaluations to tie quality scores to concrete configuration diffs